VisualDF: Example
The program below demonstrates the results of a comparison of paper & pencil v. internet based tests of the same items. This example is described in Meade (2010). In this example, the item parameters and data have been entered. Note: Example runs older version 1.3.
Go to the Data sheet, and click the My Lowest Response Option is Zero button to compute theta scores. Then, on the Theta sheet, click Compute Statistics Now. The indices will appear on the Summary sheet.
Menus and Features
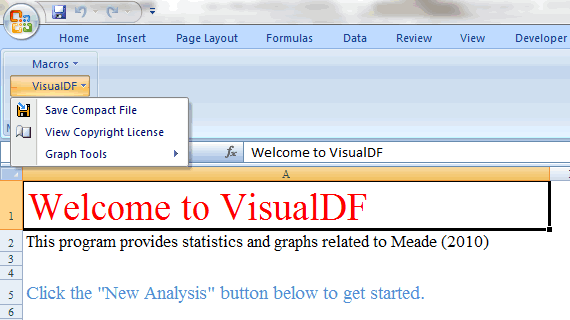
The program will create a new toolbar called VisualDF under the Add-Ins tab.
The Save Compact File option will delete all sheets except those needed to re-run the analysis later. This results in a much smaller file for saving.
The Graphs Tools sub-menu includes the following options:
- Graphs with Individual Markers – creates graphs with triangular markers for each respondent. Useful to see if there are respondents at theta levels where DF is present.
- Rename Foc/Ref Groups – allows you to easily rename the groups in your graphs.
- Make Black & White – changes graph lines from color to B&W with the focal group using a dotted line.
You may customize your output in any way you’d like using Excel’s typical features.

